Linear Inequality Graph
How to Use this Applet
Definitions
- <SHIFT>+drag: Hold down the <SHIFT> key, then drag the described object.
- <CTRL>+drag: Hold down the <CTRL> key, then drag the described object.
- <CTRL>+<SHIFT>+drag: Hold down both the <CTRL> key and the <SHIFT> key, then drag the described object.
- ⇒: One of the following relationships:
- less than ( < )
- less than or equal to ( ≤ )
- equal to ( = )
- greater than or equal to ( ≥ )
- greater than ( > )
Control and Keyboard Functions
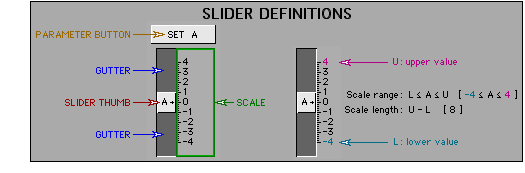
- Use the slider controls to change the following parameters:
- m and b in the linear relation y ⇒ mx + b.
- a, b and c in the the linear relation ax + by ⇒ c.
- n in the linear relation y ⇒ n.
- n in the linear relation x ⇒ n.
- Drag the slider thumb to change the value of a parameter. Use the <UP> and <DOWN> arrow keys to increase or decrease the selected parameter. (Use the keys for fine adjustments.)
- NOTE: If a key doesn't respond:
- position the cursor in the applet frame
- click the mouse button
- try the key again.
- Use the <LEFT> and <RIGHT> arrow keys to change the selected parameter. The selected parameter will have light blue slider gutters.
- Drag a slider scale to change the range of the scale while maintaining the scale length.
- Drag a location in a slider gutter towards or away from the thumb to change both the range of the scale and the scale length.
- Select the corresponding parameter button to enter a value for a parameter.
- Select the MOVE ORIGIN button, then drag in the graph area to move the entire coordinate system.
- Select the CHANGE A SCALE button, then drag in the graph area, towards or away from:
- the x-axis, to change the y-axis scale.
- the y-axis, to change the x-axis scale.
- Select the PRECISION button to set number rounding.
- Select the TRACE button to see if the corresponding cursor location is on the graph by using verification.
- Select the RESET button to restore the applet to the initial state.
Graph Area Functions for y ⇒ mx + b
- Drag the dot to move the line.
- Drag a location along the line other than the dot to change the slope of the line.
Graph Area Functions for ax + by ⇒ c
- Adjust the line by changing the parameters. There are no methods available to adjust the graph in the graph area.
Graph Area Functions for y ⇒ n and x ⇒ n
- Drag a location along the line to move the line.
General Graph Area Functions
- <SHIFT>+drag in the graph area to move the entire coordinate system.
- <CTRL>+drag in the graph area, towards or away from:
- the x-axis, to change the y-axis scale.
- the y-axis, to change the x-axis scale.
- <CTRL>+<SHIFT>+move in the graph area to identify if the corresponding cursor location is on the graph by substitution of coordinate values into the inequality.