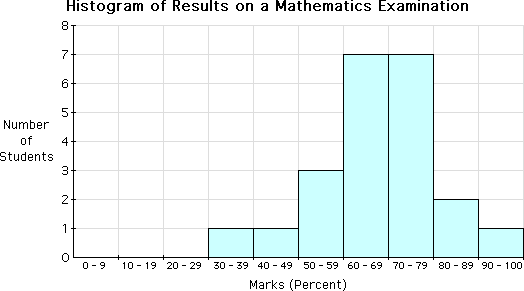
A histogram is a graph consisting of bars used to visually represent a frequency table where at least one of the scales represents continuous data.
The width of a bar represent a class interval, and the height of a bar represents the frequency of data in the interval.
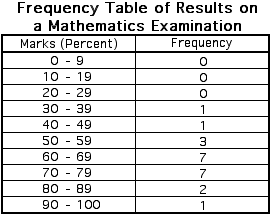
Below is a list of results (in percent) of twenty students on a mathematics examination.
38, 46, 50, 55, 57, 62, 64, 65, 66, 68, 68, 72, 73, 76, 77, 77, 79, 80, 88, 93
One possible frequency table of these results is shown below.

A histogram based on the frequency table is shown below.
