This document shows you how to use this applet in a step-by-step manner. You should have the applet open; toggle back and forth between the ShowMe file and the applet as you work through these instructions.
Figure 1
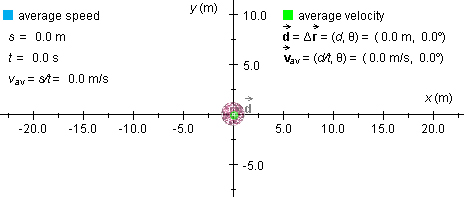
A purple ball will be at the origin of an (x,y)-coordinate system.
The green dot at the centre of the ball represents a zero displacement of the
ball. In general, the applet shows the displacement from the start of the motion
to the moment the motion is stopped by a green arrow. The displacement is labeled
 in boldface with an arrow above the d
to indicate that displacement is a vector quantity.
in boldface with an arrow above the d
to indicate that displacement is a vector quantity.
In the column below, labeled "average velocity", the values
of the displacement = Δ and average velocity
  av
are displayed. The average velocity is taken from the beginning of the motion
up to the instant at which the motion is stopped.
av
are displayed. The average velocity is taken from the beginning of the motion
up to the instant at which the motion is stopped.
At the beginning, the displacement has magnitude d = 0.0 m and direction angle θ = 0.0°, where θ is measured counter-clockwise from the positive x-axis.
At the beginning, the average velocity has magnitude |
av| = d/t = 0 and a direction angle θ = 0. Note
that the average velocity is always in the same direction as the displacement.
The column on the left, labeled "average speed", shows the distance traveled s, the time t elapsed since the beginning of the motion, and the average speed vav from the beginning of the motion until the moment the motion is stopped. These quantities are all equal to 0 at the beginning of the motion.
Press the Initial Position control button. Then move the mouse cursor into the applet display panel. The (x,y)-coordinates of the point to which the cursor points will be shown. Move the cursor to (x,y) = (10.0 m,-15.0 m) and click the mouse. The ball is now fixed at this initial position. You can also click the mouse button when the cursor is at some other point and then drag (while keeping the mouse button pressed) with the mouse to the point you want.
You may find it easier to place the ball at (x,y) = (10.0 m,-15.0 m) if you first display the coordinate grid. Reset the applet, click "Grid", and place the ball at (x,y) = (10.0 m,-15.0 m). You should see the following:
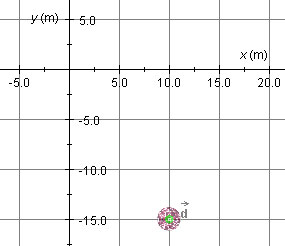
Figure 2
You simulate the ball's motion yourself by dragging the ball. The time elapsed while dragging the ball is displayed by the applet.
Click on the ball and press the mouse button. Observe the clock running while the mouse button is pressed down, even if you are not moving the ball. Release the mouse button and observe that the clock stops.
When the mouse button is pressed a second time, the clock resumes running and shows the time elapsed from the first time you pressed the mouse button, not from when you pressed it the second time. The elapsed time does not advance while the mouse button is not pressed.
The clock shows the time elapsed from the first time you pressed the mouse button until the current instant, not including times when the mouse button was released.
The elapsed time shown is not real time.
With the initial position of the ball set at (x,y)i
= (10.0 m,-15.0 m), drag the ball to near (x,y)f =
(-20.0 m,-10.0 m) along a curved path, as in the snapshot in Figure 3 below.
The path is shown in blue and the displacement vector
in green.
To display the initial and final position vectors,
i and f, respectively, click the Position Vector
control button. To display the additional data under "average velocity",
click the Data control button. With the position vectors and data displayed,
you should see something similar to what is shown below.
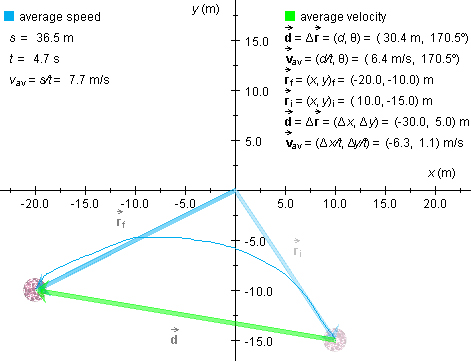
Figure 3
Observe that the average speed has the value vav = 7.7 m/s
and the average velocity a magnitude of |
av| = d/t = 6.4 m/s.
Correspondingly, the distance traveled s and the magnitude d of the displacement have the values 36.5 m and 30.4 m, respectively. The time elapsed is equal to 4.7 s.
Observe that the average velocity and the displacement have the same direction angle θ = 170.5°. This angle is measured counter-clockwise from the positive x-axis. No direction angle is given for the average speed because average speed is a scalar and not a vector quantity.
With the ball still near (x,y)f = (-20.0 m,-10.0 m), click on the ball again, but do not drag it. Observe how the elapsed time advances and the values of the average speed and the magnitude of the average velocity keep on decreasing.
To return the ball to its starting position at (x,y)i = (10.0 m,-15.0 m), click "Rewind".
With the initial position of the ball at (x,y)i =
(10.0 m,-15.0 m), press down the "Shift" key and, while keeping this key pressed
down, click on the ball and drag it left to near (x,y) = (-20.0 m,-15.0 m).
Make sure that you are pressing the "Shift" key before
clicking on the ball. If you display the position vectors and the data (see
the preceding section "Position Vectors"), but not the grid, you should
see something similar to what is shown in Figure 4 below. The displacement vector
is shown in green, the final
position vector f in blue, and the
initial position vector i
in dimmed blue.
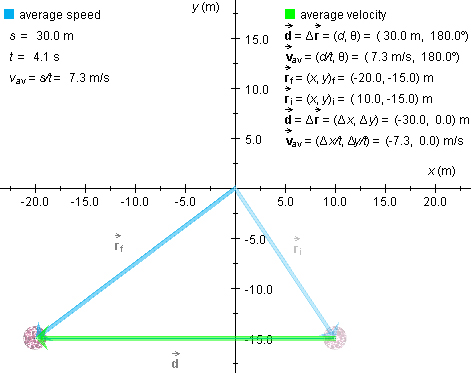
Figure 4
Observe that in this case of straight-line motion in one direction, the average speed and magnitude of average velocity have the same value: 7.3 m/s.
Again, the displacement and average velocity are in the same direction, as indicated by the same direction angle of 180°.
The average velocity av
is also displayed in terms of its (x,y)-coordinates, in the last
line under "average velocity",
av = (-7.3 m/s, 0.0 m/s).
Note: In dragging the ball along a straight line by holding down the "Shift" key, it is important to drag steadily in one direction. Otherwise, the path traveled may deviate slightly from a straight line traveled in a single direction and the values displayed for distance traveled and average speed may differ slightly from what you would expect (e.g. overshooting a target point and backtracking slightly would result in a distance traveled slightly larger than the magnitude of the displacement).
With the "Shift" key held down, you can also drag vertically or diagonally in a 45° direction.
Physics 20-30 v1.0
©2004 Alberta Learning (www.learnalberta.ca)
Last Updated: June 16, 2004