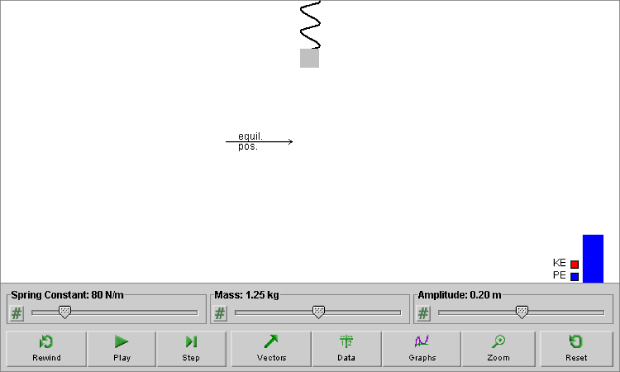
Click on a region in the image of the default applet display below to read a description of the corresponding feature:
Vary the spring constant, mass and amplitude of a weighted spring to explore visually and graphically changes in the weighted spring's potential energy, kinetic energy, velocity and position over time.
The phase angle δ and the initial displacement x(0) can be chosen before starting the motion by dragging the weighted spring left or right. The initial velocity vx(0), initial potential energy PE(0), initial kinetic energy KE(0), and initial energy E will be adjusted accordingly.
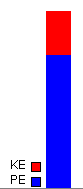
Energy Bar
The energy bar is a vertical column in the lower right-hand corner of the applet display panel that shows the potential energy (PE) of the oscillating weight in blue and the kinetic energy (KE) in red. The potential energy is taken to be zero when the weight is at its equilibrium position.
You can adjust slider settings by either dragging the slider tab to the right (increase) or left (decrease), clicking to the right or left of the slider tab for fine adjustments, or entering an exact value in the data entry field that can be opened by clicking on the Data Entry button to the left of the slider.
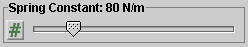 |
| Spring Constant - This slider adjusts the spring constant (k) between a minimum of 50 N/m and a maximum of 200 N/m in increments of 1 N/m. |
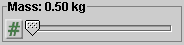 |
| Mass - This slider adjusts the mass (m) of the oscillating weight between a minimum of 0.50 kg and a maximum of 2.00 kg in increments of 0.01 kg. |
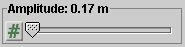 |
| Amplitude - This slider adjusts the amplitude (A) of the oscillation between a minimum of 0.10 m and a maximum of 0.30 m in increments of 0.01 m. |
The applet is controlled by the following buttons.
| Icon | Name | Description |
| Rewind | Run the applet again from the start without changing settings. |
|
| Play | Run the applet. Once pressed, this button changes into a pause button. |
|
| Pause | Pause the applet. Once pressed, this button changes into a play button. |
|
| Step Forward | Move forward step-by-step. |
|
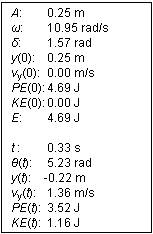
| Data | Display the "Data" box. The "Data" box can be moved to a convenient location by clicking and dragging the left mouse button when over top of the "Data" box.
Data displayed in the "Data" box includes: Upper portion - constants of the motion and initial values:
Lower portion - values of time-dependent quantities at time t:
|
|
| Graph | Display (or hide) the graph panel shown below. The panel lets you select three states for each of the graphs of the five quantities of position, velocity, potential energy, kinetic energy, and mechanical energy:
For each graph, the time t on the horizontal axis is in units of seconds (s), not radians. |
|
| Zoom | Displays the vectors and the corresponding graphs in either standard or reduced size. When clicked, the graph will be reduced in size by a factor of two. |
|
| Reset | Clear all settings and start the applet over from its default state. |
Physics 20-30 v1.0
©2004 Alberta Learning (www.learnalberta.ca)
Last Updated: June 16, 2004
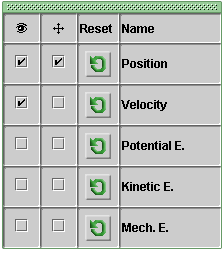
 Visibility
- this option allows you to view the graph (when checked) or turn off
the graph (when unchecked). By default, this option is unchecked.
Visibility
- this option allows you to view the graph (when checked) or turn off
the graph (when unchecked). By default, this option is unchecked. Moveability
- this option allows you to move the graph (when checked) or fix the
position of the graph (when unchecked). By default, this option is unchecked.
Moveability
- this option allows you to move the graph (when checked) or fix the
position of the graph (when unchecked). By default, this option is unchecked.