Lesson 1 - 1D Uniform Motion Builder Graphing (pos, vel)
1D Uniform Motion Builder Graphing (pos, vel) simulates the uniform motion
of an object and constructs position-time and velocity-time graphs to analyze
one-dimensional motion.
Prerequisites
Students should have a basic understanding of position-time and velocity-time
graphs.
Learning Outcomes
Students will practice constructing and using position-time and velocity-time
graphs to investigate one-dimensional motion.
Instructions
Students should understand the applet functions that are described in Help and ShowMe.
The applet should be open. The step-by-step instructions on this page are to
be done in the applet. You may need to toggle back and forth between instructions
and applet if your screen space is limited.
Contents
- Using Position-Time and Velocity-Time Graphs to Represent Motion
in One-Dimension
- How the Slope of a Position-Time Graph is Related to Velocity
- How the Area of a Velocity-Time Graph is Related to Displacement
- Solving Complex Problems Using 1D Uniform Motion Builder Graphing
(pos, vel)
Graphs are powerful visual tools for understanding many ideas in Physics. Making
and understanding position-time and velocity-time graphs is an important skill
for you to develop. Study the following graphs and provide a brief description
of the motion similar to the following example.
|
Example: A student is jogging along a straight path. The foloowing
graph shows her position (measured from her starting position) plotted
against time.
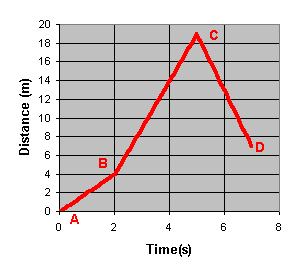
- Answer the following questions.
- What is the greatest distance she traveled from her starting point,
and when did this occur?
(Answer: By inspection of the graph, the highest value for the
distance is 19 m and this occurs at t = 5 s.)
- What is different about her motion from 0 - 5 s (points A
- C) compared to her motion from 5 - 7 s (C -D)?
(Answer: From A - C the distance from the starting point is getting
bigger. After this point, the distance begins to decrease. She must
have turned around and is now running back.)
- For what part of her motion was she traveling the fastest?
Explain your answer.
(Answer: Between point C - D she traveled (19 m - 7 m)
= 12 m in a total of (7 s - 5 s ) = 2 s. Her
rate of speed was (12 m)/(2 s ) = 6 m/s. This is
faster than any other section of the graph.)
|
- Eager to get to Physics class, a student pulls out of the
driveway and "floors-it"! The following graph shows the position
of his car as a function of time.
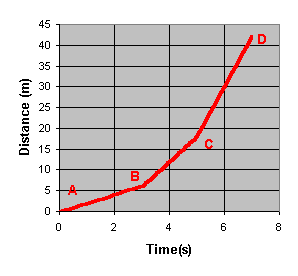
- How far did the car travel in the first 5 seconds?
- When did the car have its highest speed - explain how you can tell
this just by looking at the graph (no calculations).
- Calculate the highest speed that the car had over the seven
seconds plotted here.
- What was the average speed of the car over the 7 second interval?
(Remember, average speed is defined by:
 ) )
|
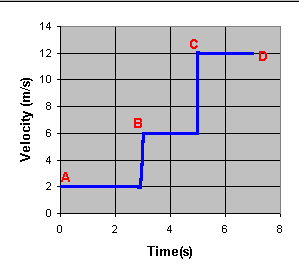
- The following graph shows the velocity -time graph for a radio
controlled race car.
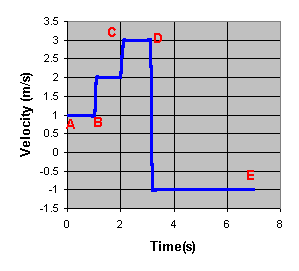
- What is the fastest speed for the model car? When does this occur?
- What is the lowest speed (careful - there are two answers!) and when
does this occur?
- Can you tell how far the car traveled just by looking at the graph?
- The graph shows four distinct "phases" for the motion.
Fill out the following table and then enter these values into the applet1D
Uniform Motion Builder Graphing (pos, vel) and reproduce the graph shown
above.
| Time Interval (s) |
Velocity (m/s) |
| 0 - 1 |
______ |
| 1 - 2 |
______ |
| 2 - 3 |
______ |
| 3 - 7 |
______ |
|
- The velocity-time graph for an object is shown below.
- How fast was the object moving between t = 3 seconds and t = 5 seconds?
How far did it travel during this interval?
- How could you determine the distance that the object would travel
for the entire 7 seconds plotted here?
- There are three distinct phases for the motion plotted here.
Identify these phases and fill out the following table. Use this information
and the applet 1D Uniform Motion Builder Graphing (pos, vel) to reproduce
the graph shown here.
|
Time Interval (s)
|
Velocity (m/s)
|
|
_____
|
______
|
|
_____
|
______
|
|
_____
|
______
|
|
|
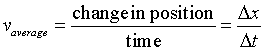
The slope of a graph is a measure of how steep the graph is. We define
slope mathematically as the ratio "rise/run". Rise on a Position-Time
graph represents distance traveled and run represents the time taken.
If we apply the "rise/run" idea here we get an expression for
average velocity . The following graph is the same one that you saw in the
example above.
We can write the following formula:
To see how this works, let's put in the correct numbers
for x and t at the points "C" and "D". We then get:
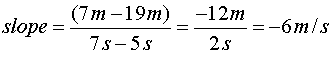
This is the velocity of the jogger in the example above
for the interval C-D.
|
- Find the velocity of the jogger from the example above for the intervals
A-B and B-C shown on the previous graph.
|
- The applet 1D Uniform Motion Builder Graphing (pos, vel)
has the ability to show you slopes of position-time graphs. To see how
this is done, enter the following time and velocity motion scripts in
the applet:
- script1: t = 2 s , v = 2 m/s
- script2: t = 3 s , v = 5 m/s
- script3: t = 2 s , v = -6 m/s
Your graph should look like the one shown here.
- Use the slope tool to measure the slope for the three intervals
that you plotted and verify that the slopes agree with the velocities
that you entered.
|
- In the space provided, sketch the velocity-time following graph
for the motion you defined in question 6. Verify that your sketch is
correct by using 1D Uniform Motion Builder Graphing (pos, vel).
|
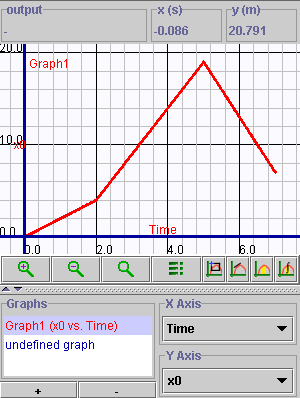
The following graph is very similar to the
one you constructed in question 2b.
The graph agrees with the motion scripts that you entered and shows that:
- between t = 0 s and t = 2 s the jogger moved with a velocity of
2 m/s
- between t = 2 s and t = 5 s the jogger moved with a velocity of
5 m/s
- between t = 5 s and t = 7 s the jogger moved with a velocity of
- 6 m/s
- How far did the jogger travel in the first 2 seconds? How
far did the jogger travel between t = 1s and t = 4 s?
The distance calculations that you did in question 8 were very easy and
you had no trouble showing that the distances traveled were 4 m and
12 m respectively. You should also be able to see that these numbers
are exactly the area between the velocity-time graph and the time axis.
The following statement reflects a very important property of all velocity-time
graphs.
The area between a velocity-time graph and the time-axis
for a given interval of time is equal to the displacement of the object
in that interval of time.
|
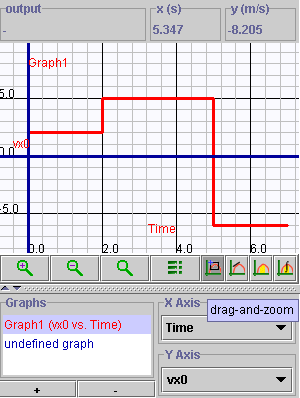
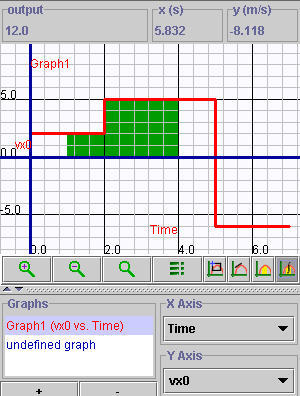
| You can use the graphing features of the
1D Uniform Motion Builder Graphing (pos, vel) applet to easily verify
this. Select the area tool and show that the distance traveled between
t = 1 s and t = 4 s is 12 m. Your graph should look like the
one shown. Note the value displayed in the "output window".
- Now consider the area for the entire interval 0 - 7 s.
How far was the jogger from her starting point at t = 7 s? Why
is this less than her position at t = 5 s?
|
- It's important to know how to define your terms! Explain
the difference between the terms 'distance' and 'displacement'
as they are used in Physics.
|
- Explain why the following statement, in general, is false:
"The area between a velocity-time graph and the time-axis equals
the distance traveled."
|
Use the 1D Uniform Motion Builder Graphing (pos, vel) applet to answer the
following questions.
- Melanie is sprint-cycling and gets off to a good start pedaling at
a rate of 12 m/s for 10 s. She tires and slows down to 9.8 m/s
for the next 16 s. When she gets close to the finish line she begins
pedaling at 11.5 m/s for the next 2 s. Sketch her position-time
graph and velocity-time graphs in the space below.
- How far did Melanie travel?
- What was her average velocity for the trip?
- You may have learned to average numbers by "adding them up and
dividing". Try that strategy here. Why does the answer you got
in part b not agree with this? Which is correct?
|
- Consider an object that speeds up by 10 m/s for every
second that it moves. For example, during the first second it travels
at 10 m/s, during the second second it travels at 20 m/s,
and so on. Complete the following table:
|
Time Interval (s)
|
Velocity (m/s)
|
|
0 - 1
|
_______
|
|
1 - 2
|
_______
|
|
2 - 3
|
_______
|
|
3 - 4
|
_______
|
|
4 - 5
|
_______
|
|
5 - 6
|
_______
|
|
6 - 7
|
_______
|
|
7 - 8
|
_______
|
- In the space below sketch both the position-time and velocity-time
graphs for this motion. (Try to do this without using 1D Uniform Motion
Builder Graphing (pos, vel) and then check your results with the applet).
- How would you describe the "shape" of the position-time
graph? What familiar "curve" does it remind you of?
- How would you describe the "shape" of the velocity-time
graph? What would happen to the shape of this graph if you defined smaller
and more numerous time intervals?
- What very common kind of motion does the above example approximate?
|
Physics 20-30 v1.0
©2004 Alberta Learning (www.learnalberta.ca)
Last Updated: June 16, 2004