Lesson 1 - 1D Non-Uniform Motion Builder Graphing (pos, vel, acc)
1D Non-Uniform Motion Builder Graphing (pos, vel, acc) simulates the uniform
motion of an object and constructs position-time and velocity-time graphs to
analyze one-dimensional motion.
Prerequisites
Students should have a basic understanding of what position-time and velocity-time
graphs are and how these ideas can be applied to non-accelerated motion.
Learning Outcomes
Students will practice constructing and using position-time, velocity-time,
and acceleration-time graphs to investigate one-dimensional motion.
Instructions
Students should understand the applet functions that are described in Help and ShowMe.
The applet should be open. The step-by-step instructions on this page are to
be done in the applet. You may need to toggle back and forth between instructions
and applet if your screen space is limited.
Contents
- Exploring the Link between Slope, Velocity, and Acceleration
- Exploring the Link between Area and Total Change
- Summary of Key Concepts
- Applications to Complex Motion Problems
1. Exploring the Link between Slope, Velocity, and Acceleration
|
It is clear from both questions 1 and 2 that the velocity of the object
discussed above is not constant. The velocity is continuously changing
from a value of 2 m/s to a value of 52 m/s after 10 seconds. You have
clear evidence that the object is accelerating.
Now, use 1D Non-Uniform Motion Builder Graphing (pos, vel, acc) to create
a velocity-time graph from the same script that you entered in #1. The
graph you produce will look very much like the one you made in part 2b.
This graph is shown below.
|
|
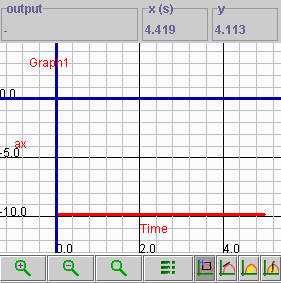
- What is the slope of this graph? Explain how you determined this.
- What are the units that correctly describe the slope of this graph?
- What does the slope "mean" here? That is, what quantity
of motion does the slope measure?
|
|
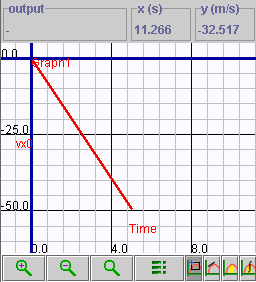
- The graph shown on the right was produced using 1D Non-Uniform
Motion Builder Graphing (pos, vel, acc) and the motion script used in
the previous questions. It is an acceleration-time graph. Use 1D Non-Uniform
Motion Builder Graphing (pos, vel, acc) to create this graph. In question
3 you determined the slope of the velocity-time graph for the motion.
Where or how does that "appear" on this new graph?
- What is the slope of the graph shown on the right? What does this
"mean" ?
|
2. Exploring the Link between Area and Total Change
Fill in the blanks:
|
A change in position in an interval of time is called
|
__________________________ |
|
A velocity acting for an interval of time produces a change
in
|
__________________________ |
|
A change in velocity in an interval of time is called
|
__________________________ |
|
An acceleration acting for an interval of time produces
a change in
|
__________________________ |
- In this section, we will explore the idea that area is a measure of
the total or cumulative change in some variable. To start this we will
use 1D Non-Uniform Motion Builder Graphing (pos, vel, acc) to prepare
an acceleration-time graph for a ball falling from rest for 5 seconds.
Enter the motion script:
- Time = 5.0 s
- Time step = 0.1 s
- Velocity X = 0.0 m/s
- Acceleration X = -9.81 m/s2
Next, use the area tool ( )
and measure the area starting from t = 0 s each time. Complete
the following table: )
and measure the area starting from t = 0 s each time. Complete
the following table:
|
Time (s)
|
Area
|
|
1
|
_______
|
|
2
|
_______
|
|
3
|
_______
|
|
4
|
_______
|
|
5
|
_______
|
|
- Each of the areas that you created were simple rectangles.
The area of a rectangle is just "length x height".
- What units are appropriate for the "length" for each
of these rectangles?
- What units are appropriate for the "heights" of these
rectangles?
- What units are appropriate for the areas that you created?
|
- The results of question 2 show us that the area of an acceleration-time
graph tells us the total change in the velocity of motion. We can do
the same thing relating velocity and position. Create a velocity-time
graph for the motion script that you used in the previous question.
Your graph should look similar to the one shown below.
- Next, use the area tool ()
and measure the area starting from t = 0 s each time. Complete
the following table:
|
Time Interval (s)
|
Area
|
|
1
|
_______
|
|
2
|
_______
|
|
3
|
_______
|
|
4
|
_______
|
|
5
|
_______
|
|
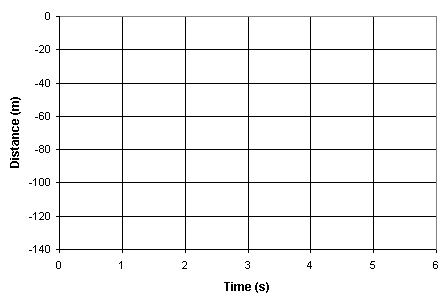
- Plot the data that you collected in question 3 on the grid
provided for you below. Explain what this graph shows. Why are the positions
that you are plotting "negative"?
|
3. Summary of Key Concepts
All the above relate important geometric properties of graphs
to actual properties of motion. We can summarize all of this in a convenient
table:
|
Slope Properties
|
Area Properties
|
|
Slope of a position-time graph tells you instantaneous
velocity
|
Area of a velocity-time graph tells you total change
in position
|
|
Slope of a velocity-time graph tells you instantaneous
acceleration
|
Area of an acceleration-time graph tells you total change
in velocity
|
4. Applications to Complex Motion Problems
Let's conclude this lesson by considering some complex situations in which
the motion of an object consists of a number of different parts. Use 1D Non-Uniform
Motion Builder Graphing (pos, vel, acc) to assist you in answering these questions.
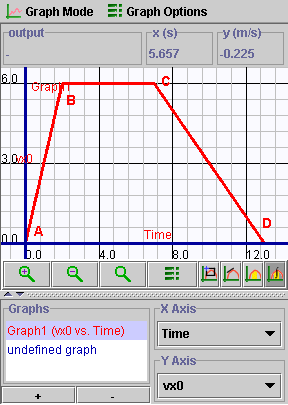
- You are riding in an elevator. The elevator accelerates upward at
2 m/s2 for 5 s and then coasts at a steady speed
for 20 s. It then begins to decelerate at 4m/s2 for
2.5 s. In the spaces provided below, sketch:
- the x-t graph for this motion
- the v-t graph for this motion
- the a-t graph for this motion
- What was the maximum speed reached by the elevator?
- How far did the elevator travel while coasting?
- How far did the elevator travel while decelerating?
|
- Brenda is standing on the edge of a cliff and, as a "physics
experiment", tosses her physics book upward with a speed of 22 m/s.
It hits the ground at the base of the cliff 6 seconds later.
Use 1D Non-Uniform Motion Builder Graphing (pos, vel, acc) to determine
how high the cliff is and how fast the book was moving when it landed.
|
- You are programming a control computer on a subway train.
The train accelerates at 2 m/s2. The maximum speed of the subway
is 30 m/s. The maximum allowable deceleration rate is 3 m/s2.
The total distance that the subway car travels between stops is 1 km.
Use 1D Non-Uniform Motion Builder Graphing (pos, vel, acc) to create
motion scripts that could accomplish this. Please answer the following:
- Sketch what the v-t graph should look like for this motion and
put your sketch in the place provided below.
.
- How much time is spent accelerating?
- How far does the subway train travel while accelerating?
- How far will the subway travel travel while decelerating?
- How much time will it take for the subway train to travel
between the stops?
- What is the average speed of the train as it travels
between stops?
|
Physics 20-30 v1.0
©2004 Alberta Learning (www.learnalberta.ca)
Last Updated: June 16, 2004

 )
to help complete the following table. From the data you collect, sketch
a velocity-time graph in the space provided below. (Tip: double-click
on the slope tool button to enter the exact value for the point you
wish to examine)
)
to help complete the following table. From the data you collect, sketch
a velocity-time graph in the space provided below. (Tip: double-click
on the slope tool button to enter the exact value for the point you
wish to examine)
_eq1.gif) (b is a constant)
(b is a constant)_eq2.gif) (b is a constant and m is the slope)
(b is a constant and m is the slope)_eq3.gif) (where a, b, and c are coefficients)
(where a, b, and c are coefficients)